Epsilon Aurigae
Low Resolution Spectroscopy monitoring
Images and Analisys by: J.D.Strikis "Elizabeth Observatory of Athens"
2010-08-27 01:35:26.0 JD 2455435.566273
|
Low resolution spectroscopy is something that every amateur astronomer can do from his backyard, and it is really interesting as with verry low cost, we can dive in to the wonders that make our universe exist.
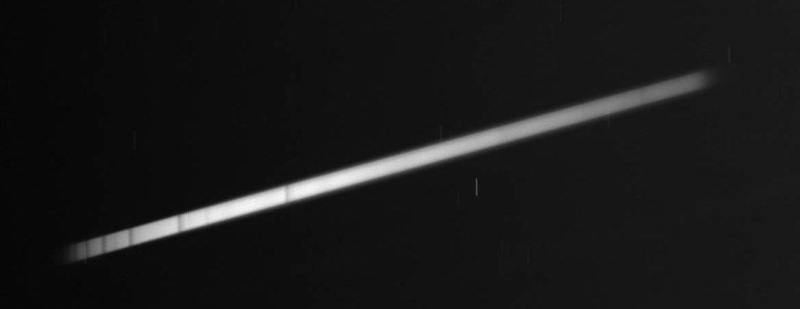
One of the most impresive things is the spectroscopy of variable stars. In this article I am going to show how I analysed the image of the low resolution spectra of Epsilon Aurigae star, an eclipsing variable with one eclipse every few decates. |

|
Uncallibrated Spectra
|
On the right is the prototype "Uncalibrated" spectral graph of the Epsilon Aurigae that I took with an 80mm Apo Refractor and a Baader Star Analyser. As you can see, some major absorbtion lines are vissible in this spectral profile.
|
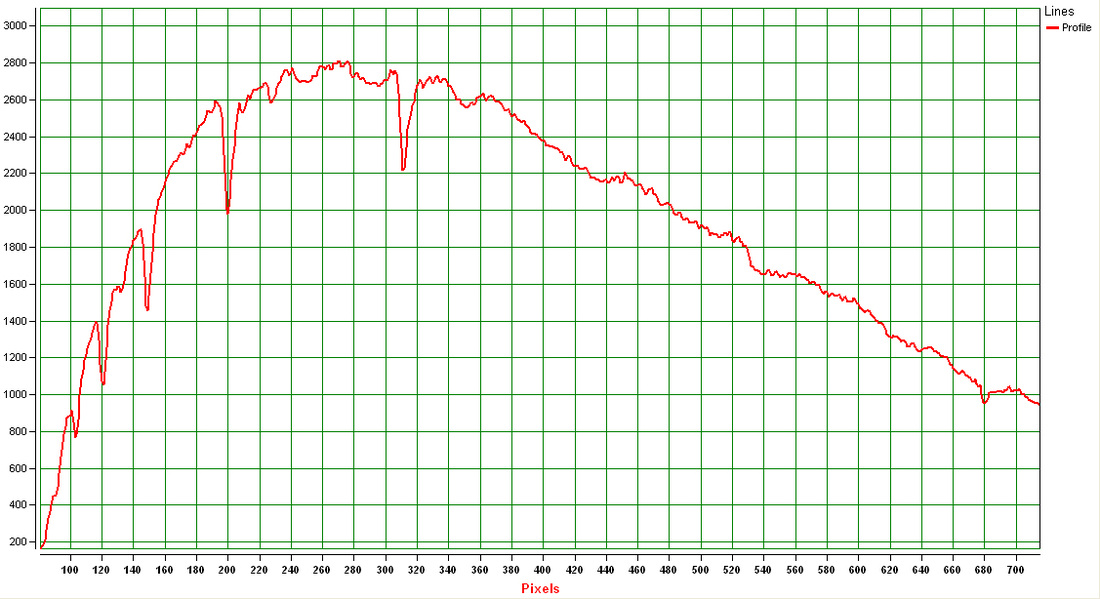
Uncallibrated Spectral Profile of Epsilon Aurigae
|
Line Determination
|
In order to determine the vissible lines in my spectrum I overlaped the 2 spectral profiles, the "a7v" profile with the known lines and my spectral profile for comparison. As you can see in the image on the right the lines of the two are verry well aligned and this is how we know which absorbtion lines we see.
|
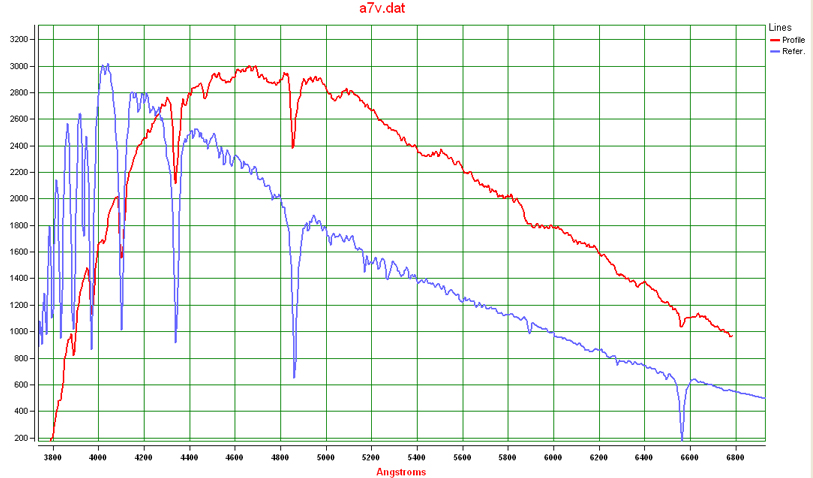
Epsilon Aurigae "raw" spectrum and "a7v" standart spectrum overlapsed for comparison
|

Instrument Responce Callibration
|
In order to get the final result of a normalized spectral profile, we need to determine the instrument responce of our CCD-Telescope-Grating setup. So after removing the absorbtion lines from our spectral profile by a series of calculations, then we apply a smoothing to our featureless curve in order to see our instrument responce.
|
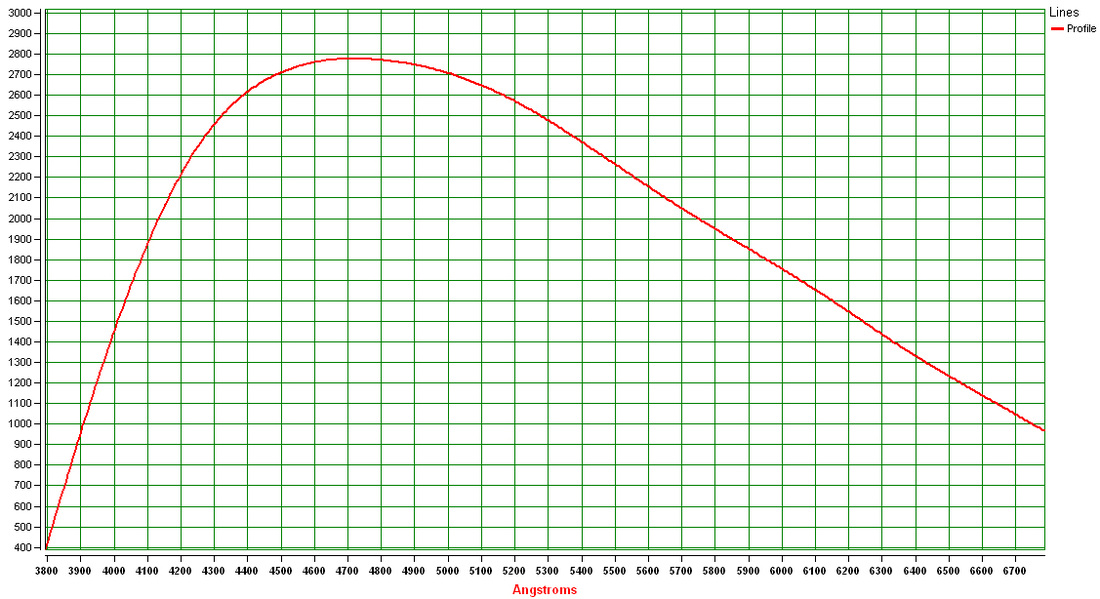
Instrument Responce of "Atik IC CCD camera" and 80mm Apo Refractor.
|

Final Result
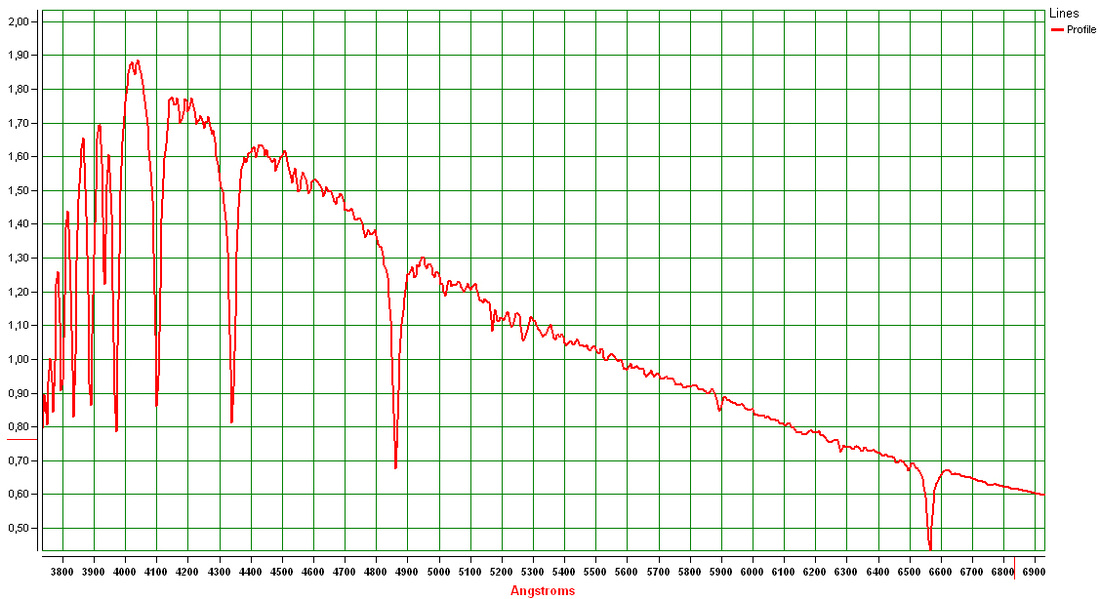
The final result of the above division of the "raw" spectra by the instrument responce,
gives us the normalized callibrated spectra that is usefull for our study of the variables nature
and other characteristics.
gives us the normalized callibrated spectra that is usefull for our study of the variables nature
and other characteristics.
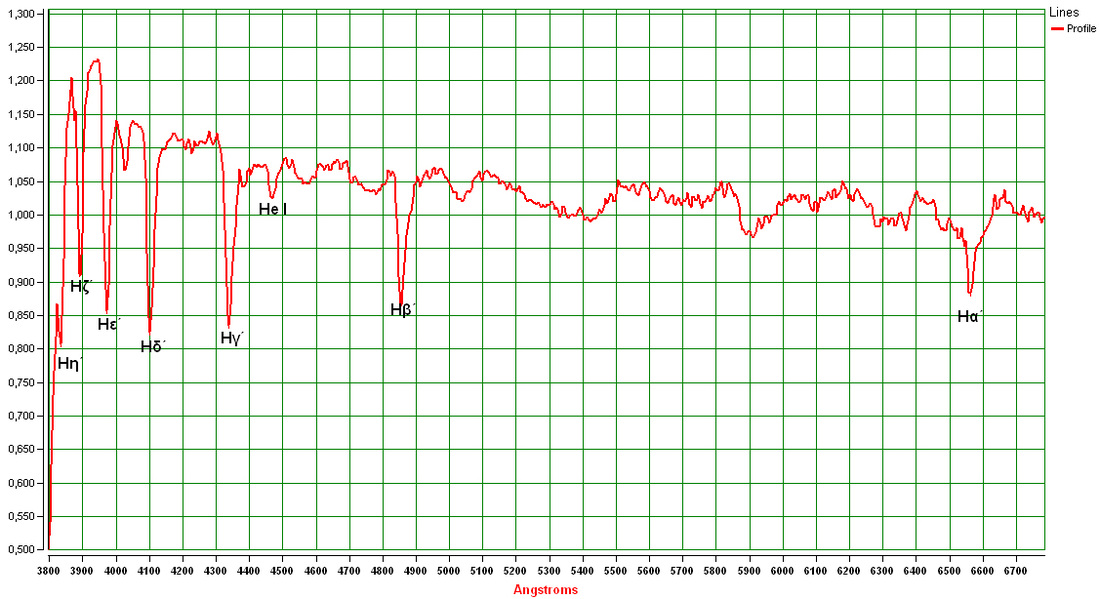
Final Spectral Profile of Epsilon Aurigae Eclipsing Binary at : 2010-08-27 01:35:26.0 JD 2455435.566273
